Hispanics and Firearms Violence
Section Two: Regional Snapshots
This section offers
information on Hispanics and firearms violence in three specific regions
of the country with uniquely comprehensive data: California, Texas,
and Chicago, Illinois.
Texas and California
are two of the states which the Centers for Disease Control and Prevention
(CDC) classifies as being part of the American Southwest (the remainder
are Arizona, Colorado, and New Mexico). Approximately 60 percent of
all Hispanics in the United States reside in the Southwest. A CDC analysis
of homicides in the Southwest from 1970 to 1983 found that firearms
were used in 65.1 percent of Hispanic homicides and that, from 1977
to 1982, Hispanics had an age-adjusted homicide rate of 22.2 per 100,000.
The study also found that Hispanic females were killed by firearms more
than any other female racial/ethnic group.19

Chart 11: Data from
Homicide Surveillance: High-Risk Racial and Ethnic Groups - Blacks
and Hispanics, 1970 to 1983 (Atlanta: Centers for Disease Control
and Prevention, 1986).
California
California has the
largest Hispanic population of any state. The state's 10 million Hispanics
comprise 30 percent of its total population. As a result, the state
has made a concerted effort to code its data collection for Hispanic
origin.
Homicide
In 1998, the California
Department of Justice found that, although Hispanics made up only
30 percent of the population, they accounted for 44 percent of all
homicide victims.20 In homicides where a weapon could be determined,
77.4 percent of Hispanics were murdered with a firearm�the highest
percentage for any racial or ethnic group.21 (See Chart 12) And when
Hispanics were murdered with a gun, it was almost always with a handgun�89.8
percent of all gun homicides. Handguns were used in 69.5 percent of
all Hispanic homicides�once again the highest of any racial or ethnic
group.22 (See Chart 13)
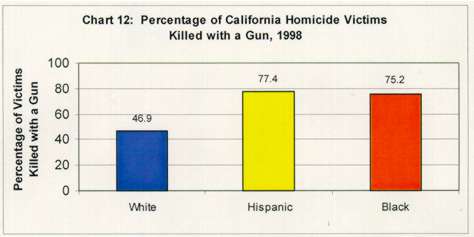
Chart 12: Data
from Homicide in California (Sacramento: California Department
of Justice, 1999): 76.
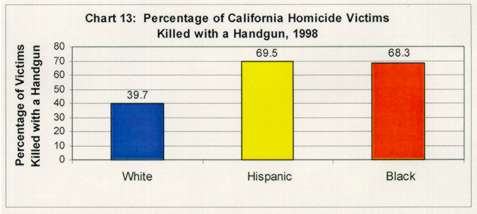
Chart 13: Data
from Homicide in California (Sacramento: California Department
of Justice, 1999): 76.
Chart 14 presents
the actual number of California homicide victims for 1998 and offers
an additional illustration of the handgun's toll on California's Hispanics.
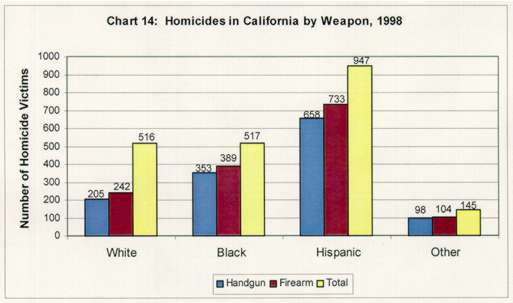
Chart 14: Data
from Homicide in California (Sacramento: California Department
of Justice, 1999): 76.
A 1999 joint study
by the California Department of Health Services, Division of Violence
Prevention, and the National Center for Injury Prevention and Control
of the Centers for Disease Control and Prevention found that, from
1995 to 1996, Hispanics had the second highest firearms death rate
(15.2 percent) of any racial/ethnic group.23 (See Chart 15)
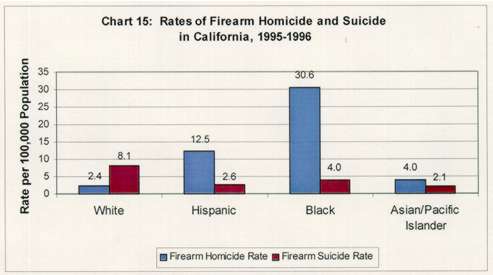
Chart 15: Data
from "Firearm-Associated Deaths and Hospitalizations�California, 1995-1996,"
Morbidity and Mortality Weekly Report 48, no. 23 (1999): 485-488.
Nonfatal
Hispanics also
had the second highest nonfatal firearms injury rate, 28.9 per 100,000.
Blacks had the highest rate at 69.4 per 100,000.24 As seen in Chart
16, most racial/ethnic groups have a higher rate of nonfatal firearm-related
injuries than firearm-related deaths. Whites are the sole exception,
the result of a markedly higher suicide rate among white males.c
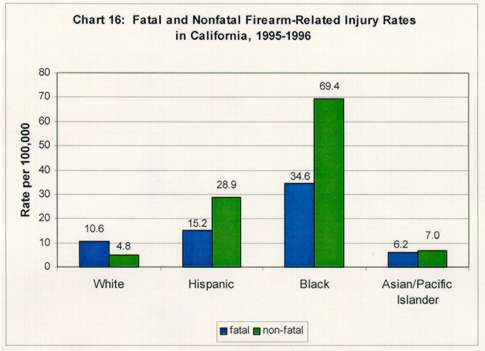
Chart 16: Data
from "Firearm-Associated Deaths and Hospitalizations�California, 1995-1996,"
Morbidity and Mortality Weekly Report 48, no. 23 (1999): 485-488.
Texas
With nearly six
million Hispanics, Texas has the second largest Hispanic population
of any state.25
Homicide
According to 1998
FBI Supplementary Homicide Report (SHR) data,26 there were 498 homicides
involving Hispanic victims in Texas in 1998.27 Of these murders, 66.9
percent (333) involved firearms. Handguns were used in 72.7 percent
(242) of all firearm murders. That same year, there were: 353 white
homicide victims, of which 58.6 percent were killed with a firearm;
and, 387 black homicide victims, of which 77.8 percent were killed
with a firearm.28
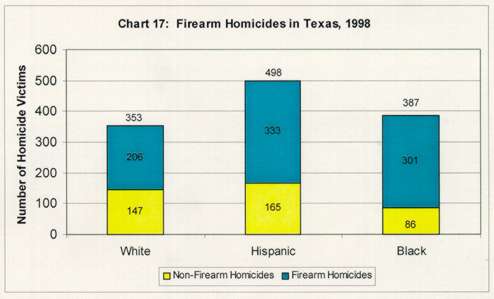
Chart 17: Data
from 1998 FBI Supplementary Homicide Report. Analysis performed by
the VPC.
For that year, nearly 15 percent of Hispanic firearm homicide victims
were 18 years of age or younger. Only 15.6 percent of Hispanic firearm
homicides occurred during the commission of another felony. Where
the victim-offender relationship could be determined, 38.9 percent
of the offenders were unknown to the victim. In cases where the victim
knew their offender, 18.1 percent involved intimate acquaintances
such as a spouse, common-law spouse, girlfriend/boyfriend, or ex-spouse.29
Another study,
"Firearm-related deaths among children in Texas: 1984-1988," found
that Hispanic children 14 years of age and younger had the lowest
rates of both firearms homicide (0.44 per 100,000) and firearms suicide
(0.19 per 100,000) of any racial/ethnic group. The highest rate of
firearms death for this group came from unintentional shootings�0.46
per 100,000.30 For Hispanic children five to 14 years old, unintentional
firearm deaths were surpassed only by motor vehicle fatalities and
drownings as a cause of injury-related death in Texas.31 In all firearm
death categories for Hispanic children, male children had higher rates
than female children.32 (See Chart 18)
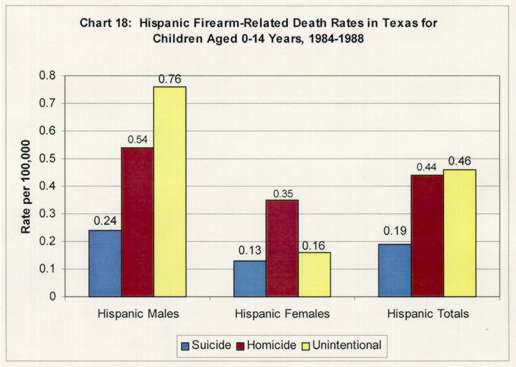
Chart 18: Data
from Patti J. Patterson et al., "Firearm-related deaths among children
in Texas: 1984-1988," The Journal of Texas Medicine 86 (July
1990): 92-97.
Chicago
The city of Chicago
is unique in that data regarding homicide has been gathered continuously
from police investigation files since 1965. The Chicago Homicide Dataset
is the largest, most detailed data set on violence available in the
United States.33 Additionally, information regarding Hispanic ethnicity
has been separately coded for many years, allowing more specific aspects
of Hispanics and firearms�such as intimate partner homicides�to be
analyzed.
In Chicago, from
1965 to 1995, 13 percent of homicide victims were Hispanic. Of these
Hispanic victims, 73 percent were killed with a firearm, compared
with 66 percent of black victims, and 49 percent of white victims.34
(See Chart 19)
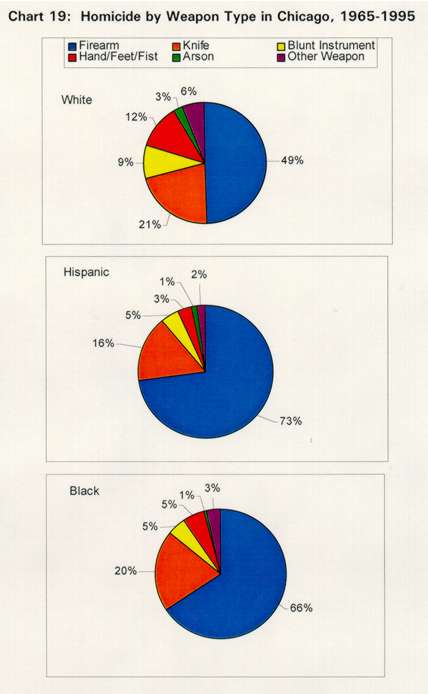
Chart 19: Data
from "Homicides in Chicago, 1965-1995," Chicago Homicide Dataset
(Inter-university Consortium for Political and Social Research,
University of Michigan), downloaded July 21, 2000, from www.icpsr.umich.edu/cgi/SDA11/hsda3;
INTERNET.
Intraracial homicides are the norm in most types of homicide, including
both firearm homicides and intimate partner homicides. A 29-year study
in Chicago looked at all three of these homicide types�intraracial,
firearm, and intimate partner�and found that firearms were used in
62.6 percent of Hispanic-on-Hispanic intimate partner homicides, the
highest usage among all intraracial intimate partner homicides.35 A
firearm was used in 60.0 percent of Hispanic-on-Hispanic homicides
where a female killed a male partner, and in 63.4 percent of Hispanic-on-Hispanic
homicides where a male killed a female partner. In contrast, a firearm
was used in 49.1 percent of white-on-white intimate partner homicides,
and in 48.9 percent of black-on-black intimate partner homicides.36
The greatest risk
of intimate partner homicide occurs at different ages for women of
different racial/ethnic groups. While the risk of being killed in
an intimate partner homicide for Hispanic women peaks at a relatively
young age (25 to 29 years old) and declines sharply thereafter, the
risk for white women peaks at ages 35 to 39 years and declines more
gradually.37
The chance of
suicide for male intimate homicide offenders in Chicago was highest
for Hispanic (21 percent) and white (25 percent) male offenders. It
was especially high for Latino husbands�as many as 29 percent of Latino
men killed themselves after killing their wives.38
c)The firearm as
a suicide tool is startlingly effective. In California, where only 10
percent of unintentional and 32 percent of assaultive firearm-related
injuries resulted in death, 90 percent of firearm-related suicide
attempts resulted in death. "Firearm-Associated Deaths and Hospitalizations�California,
1995-1996," Morbidity and Mortality Weekly Report 48, no. 23
(1999): 485-488.
Go to Section
Three: Conclusion
Back to Hispanics
and Firearms Violence Table of Contents
All contents � 2001 Violence Policy Center
The Violence Policy Center is a national non-profit educational foundation
that conducts research on violence in America and works to develop violence-reduction
policies and proposals. The Center examines the role of firearms in America,
conducts research on firearms violence, and explores new ways to decrease
firearm-related death and injury. |